LexisNexis Risk Solutions is a global data and analytics company that provides data and
technology services, analytics, predictive insights and fraud prevention for a wide range of industries. The
company’s customers include businesses within the insurance, financial services, healthcare and corporate
sectors as well as the local, state and federal government, law enforcement and public safety. LexisNexis Risk
Solutions operates within the Risk & Business Analytics market segment of RELX, a multinational information and
analytics company based in London.
Problem statement
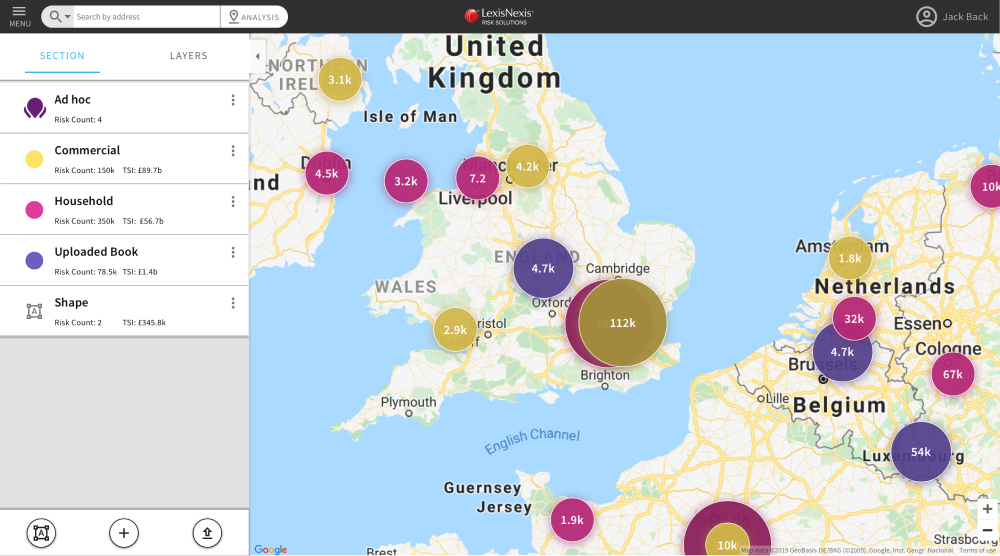
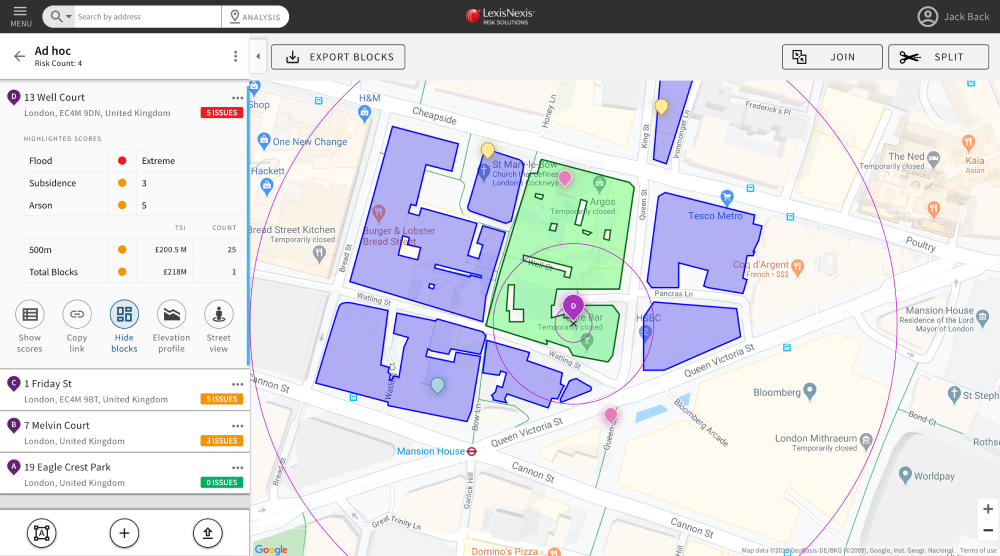
The project involved leading the redesign of LexisNexis® Map View, a property insurance assessment and risk management
tool. The primary objectives were to improve data visualization for easier interpretation of risk datasets, update risk
assessment capabilities with new data sources, and enhance the platform's ability to provide actionable insights through
predictive analytics models. The goal was to increase user satisfaction, expand the number of assessable risk factors, and streamline decision-making processes for policy pricing and portfolio management.
Improve Data Visualization
◼ Enhance the user interface to enable easier interpretation of risk datasets.
◼ Implement intuitive data visualization techniques to present complex information in a user-friendly manner.
◼ Achieve a 35% increase in user satisfaction by improving the data visualization experience.
◼ Gather positive feedback from stakeholders regarding the enhanced data visualization capabilities.
◼ Ensure the redesigned UI supports efficient risk dataset interpretation.
Expand Risk Assessment Capabilities
◼ Update risk assessment capabilities by incorporating new data sources, such as satellite imagery.
◼ Evaluate and incorporate assumptions derived from an artificial intelligence dataset evaluation into the risk assessment process.
◼ Increase the number of assessable risk factors by 24% through the utilization of the new data sources.
◼ Measure user satisfaction with the expanded risk assessment capabilities and gather positive feedback.
◼ Ensure the new risk assessment capabilities align with user needs and expectations.
Provide Actionable Insights
◼ Enhance the platform with predictive analytics models for policy pricing and portfolio management decisions.
◼ Decrease the time required to generate actionable insights by 12% through improved analytics processes.
◼ Enable portfolio managers to quickly view the portfolio state and make informed pricing and management changes.
◼ Measure the impact of predictive analytics on decision-making efficiency and accuracy.
◼ Ensure the availability of comprehensive and accurate insights for better policy pricing and portfolio management.
Research
Data Visualization: Conducted pre- and post-redesign comparison of user performance in interpreting risk datasets through data visualization. Measured the time taken to interpret complex risk data and observed a 12% reduction in interpretation time.
Conducted Usability Testing: Conducted usability testing sessions with 15 representative users to evaluate the redesigned product. Collected quantitative data on task completion rates, time on task, and error rates to measure improvements in usability.
Analyzed User Feedback: Analyzed qualitative feedback from usability testing sessions, support tickets and user surveys to identify common pain points and areas for improvement. Categorized feedback into themes and quantified the frequency of specific
issues raised.
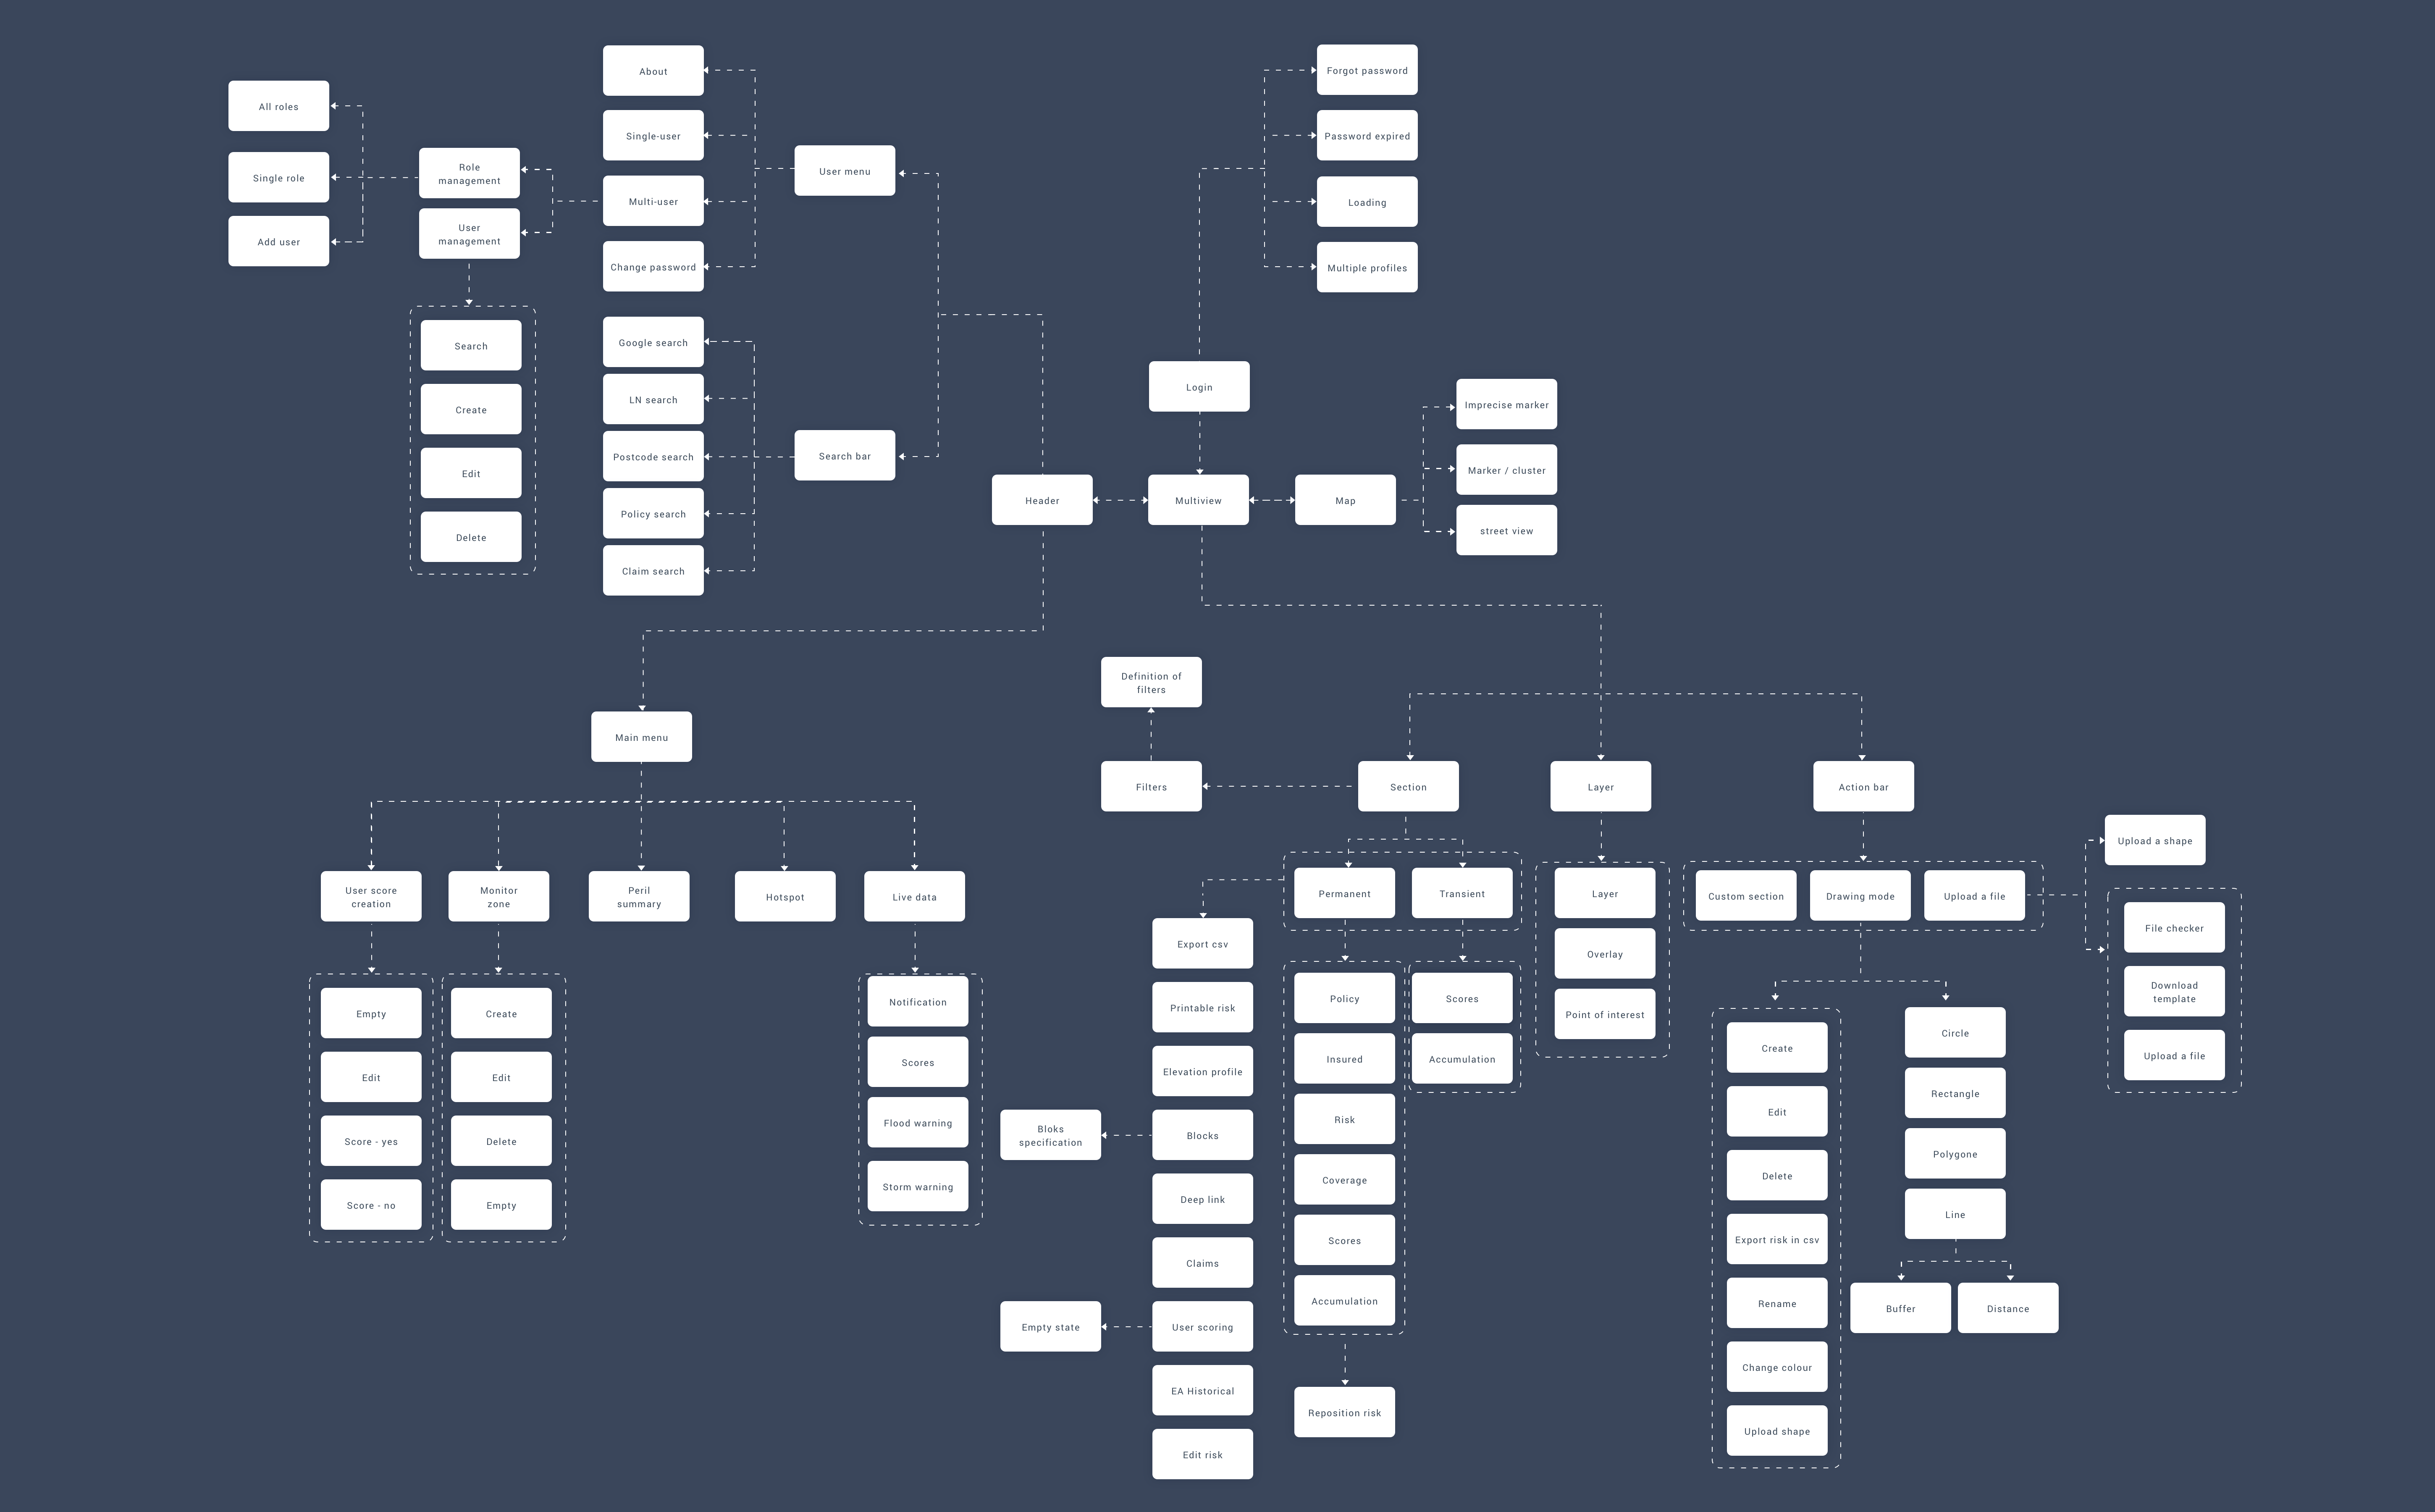
Information architecture
Competitive Analysis
Identified gaps in main competitors, such as:
Customization options for data visualization
User onboarding process
Information architecture and discoverability of the features
Contemporary and visually appealing interfaces
Data integration feature that allows users to seamlessly import and export data from other platforms or databases
Performance issues, such as slow loading times for large datasets or delays in data updates
Compatibility with different devices or browsers and across various user environments
KPI
User Adoption Rate: Measure the percentage of users who have successfully adopted and regularly use Map View, indicating the platform's acceptance and value to users.
Visualization Effectiveness: Assess user satisfaction with the clarity, accuracy, and usability of the map visualization features, ensuring that users can easily interpret and analyze the displayed data.
Response Time: Monitor the average response time of Map View to ensure a fast and responsive user experience, minimizing delays during data loading, rendering, and report generation.
User Engagement: Track user's engagement metrics such as map interactions, annotations created, and layers added, indicating the level of user involvement and active use of Map View.
Customer Satisfaction: Collect feedback from users through surveys or ratings to gauge their satisfaction with Map View's ease of use, effectiveness in data analysis, and overall user experience.
Design approach
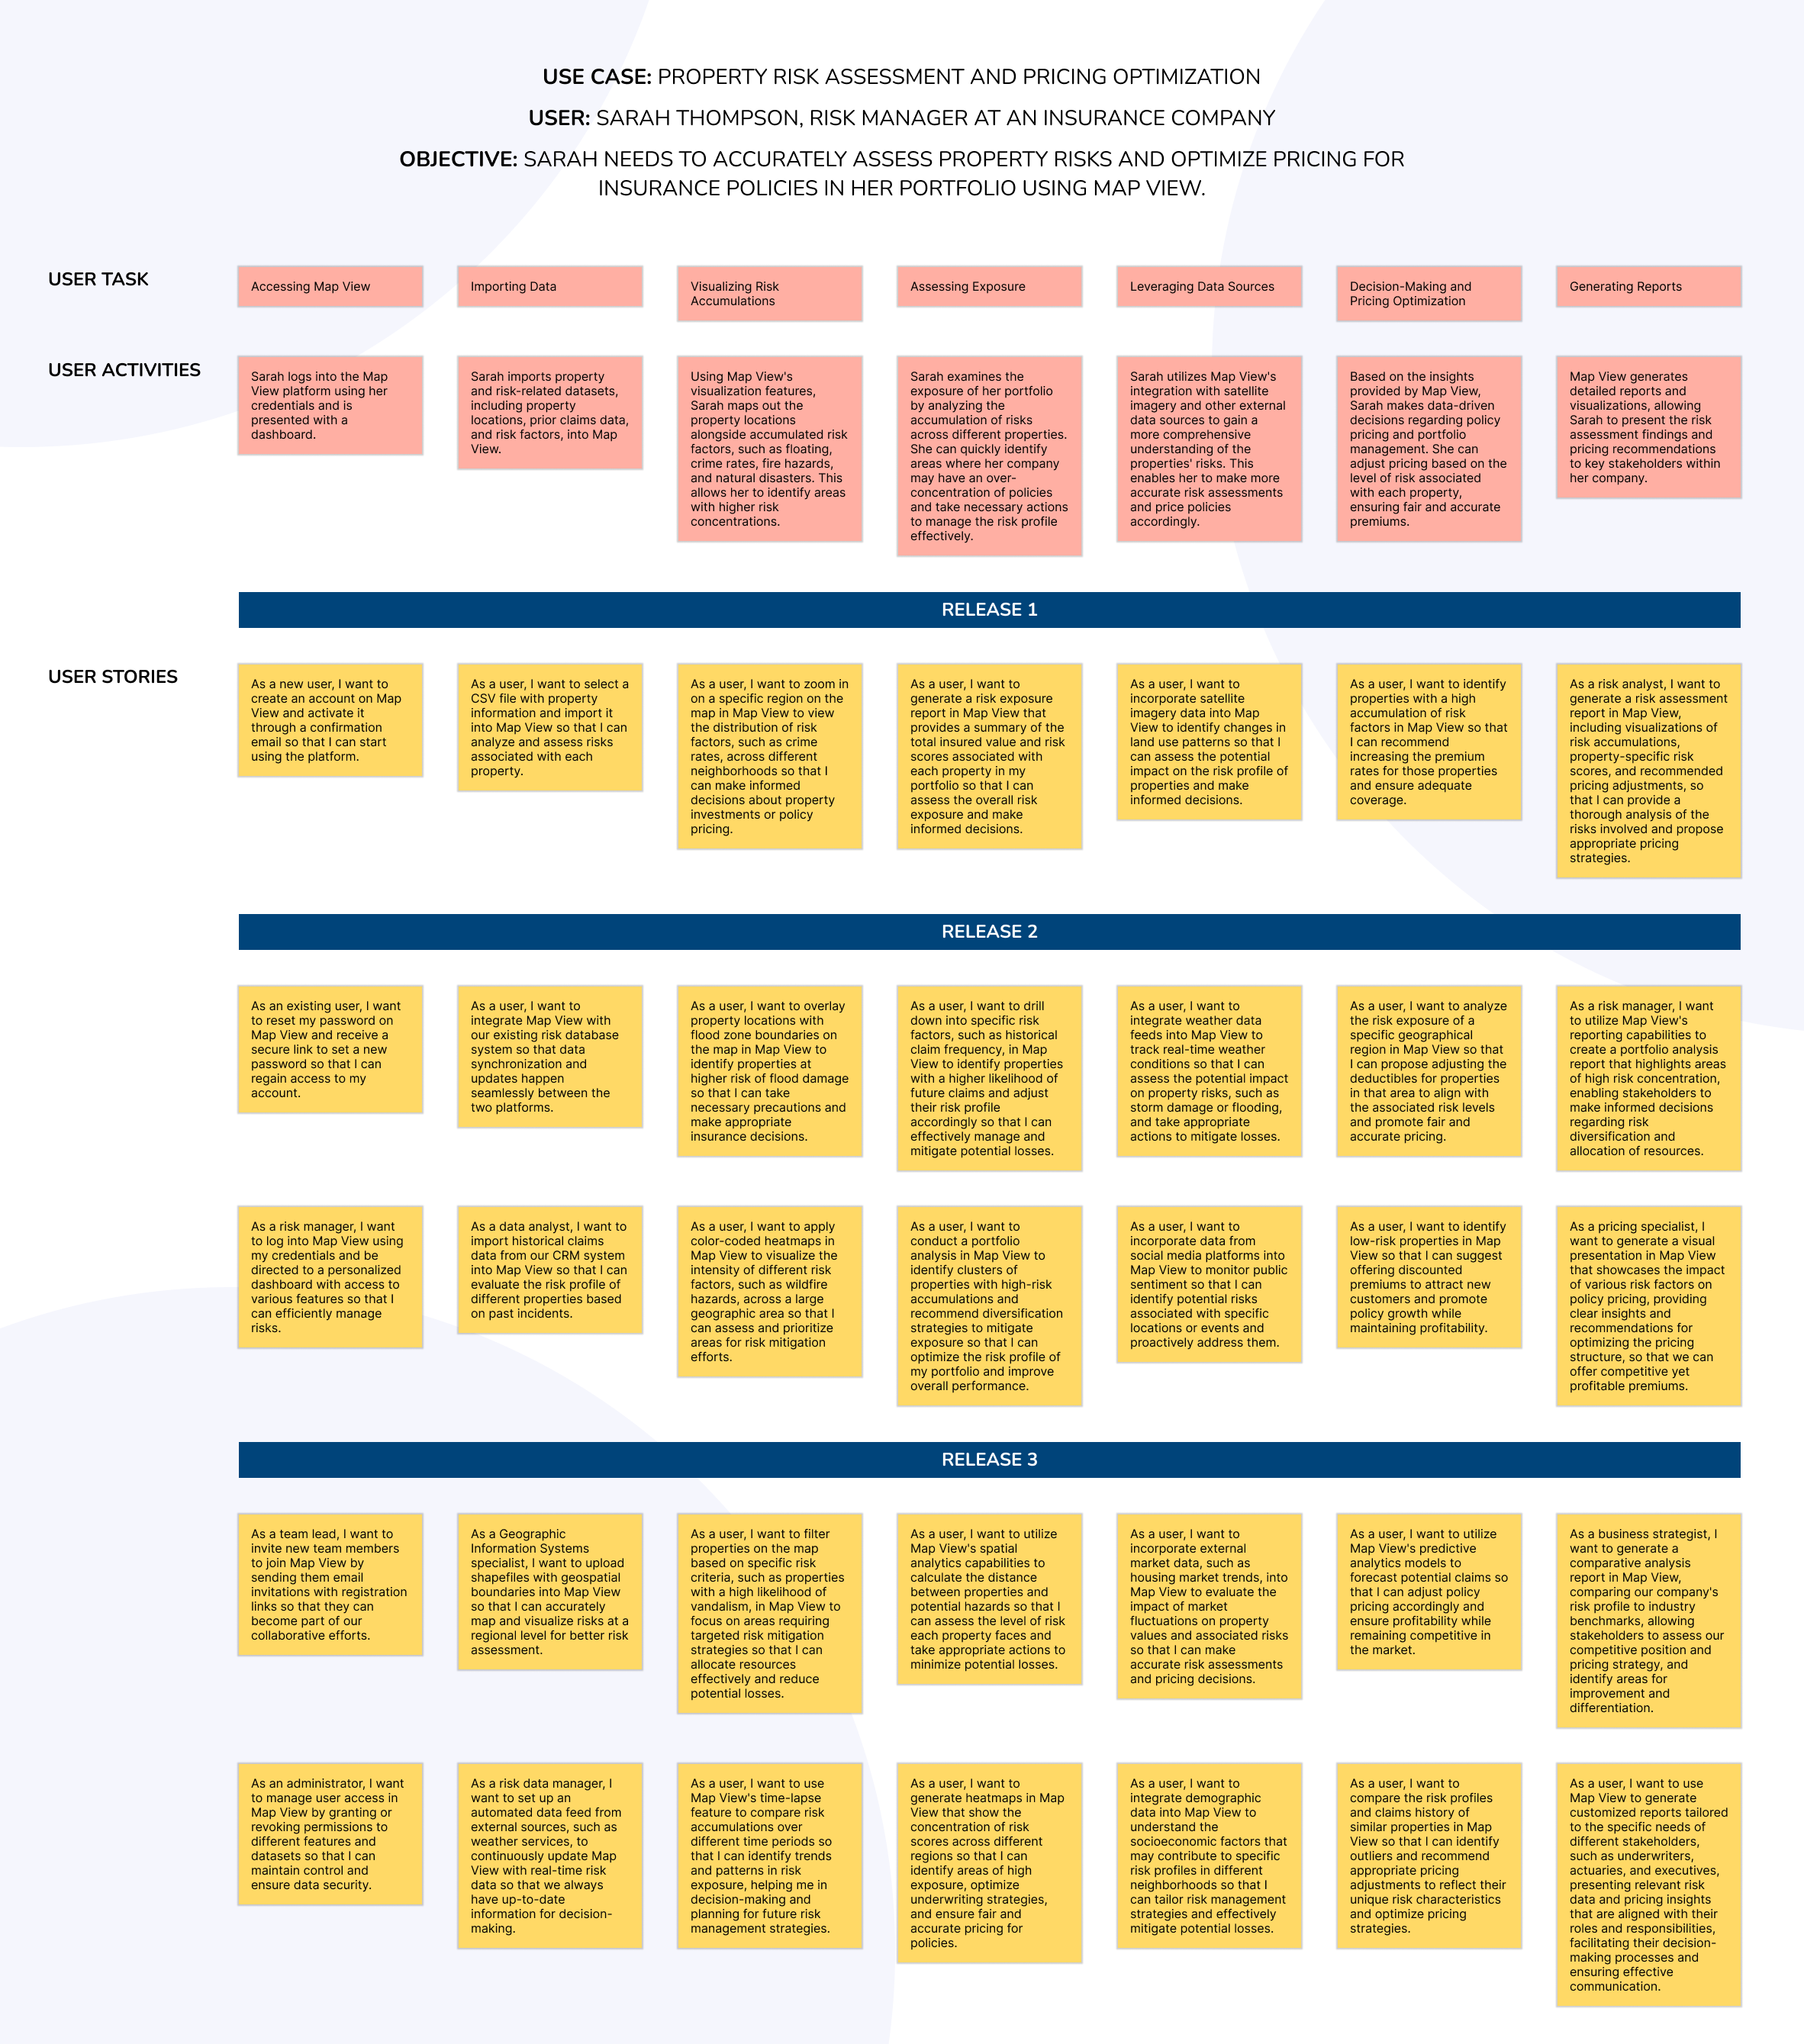
Definition of the target users' needs, pain points, and workflows.
I developed a solid information architecture that organized the application's features, data, and functionalities in a logical and intuitive manner.
Wireframing and Prototyping: I utilized wireframing to iterate on the design concepts. I collaborated with the development team and stakeholders to gather feedback. This iterative process allowed for quick validation of design decisions and ensured alignment with user requirements.
Usability Testing: To validate the design concepts, I conducted usability testing sessions on the wireframes with representative users.