Ericsson · Athlone · inside the delivery team
The company on your phone bill does not own the antenna. Ericsson does, and runs it.
A mobile operator sells you the number, the plan and the bill. Underneath that, the antennas, the base stations and the cable are Ericsson's, along with the software that keeps them running. The operator owns the customer. Ericsson owns the network.
These operators were small and regional, ten thousand cells or fewer, mostly in the United States. They cannot walk out to a mast and look at it, and they have no floor of specialists to send. What they have is a contract promising 99.999% availability, and this portal, which is the only place that promise is visible.
Five nines is twenty-six seconds a month. Every screen here is either evidence the promise is being kept, or the place you go when it is not, which is a harder brief than a dashboard and leaves no room for a tool that is itself unreliable.
Three screens
Sketched to the originals' geometry, because the argument is the interaction.
Column splits, tile ratios and content are measured off the shipped screens. What matters in each is what happens when you touch it, which a picture cannot show. All three are live. Click anything. The pins in the margin explain what each interaction was for.
Modular, because two audiences arrive wanting different things: the operator's own staff, and Ericsson's front and back office supporting them.
What you own, above what you could. The ticket counts and the Digital Fabric list stack down the left, and the second box carries licence state, trial countdown and unused value packs. Commercial state is not a separate area of the product, it is the same list.
The tabs drive the middle column only. Switching service redraws availability and capacity underneath with no page load, so comparing two services is two clicks rather than two journeys.
Activity follows the selection. The right rail is not a global feed. It answers the question already being asked: what happened to this service, most recent first.
The contract, rendered. This is the screen an operator opens when a subscriber complains, and the one they open before a renewal conversation.
---- KPI threshold
Showing 1-4 of 23 results
| Component⇅ | Instance⇅ | Start time⇅ | End time⇅ | Down |
|---|
The list is the filter. Every component carries its own month figure, its own trend and its high and low, so the left column is a summary and a control at the same time. Clicking one redraws everything to its right.
The dashed line is the promise. Not a decorative baseline. At 99.999% the monthly allowance is twenty-six seconds, so a point below that line is a contractual event and is drawn like one.
The table answers the chart. A dip is useless alone. Directly underneath, the same filter lists what broke, on which instance, when and for how long, which is the sentence the operator repeats to their own customer.
An outage is the moment a customer decides what they think of you. Every ticket ends in a score, and the scores are what the support organisation is measured on.
Showing 1-7 of 7 results
| Customer name⇅ | Closed⇅ | Ticket rating⇅ | Yearly ticket | Support rating⇅ | Yearly support |
|---|
Four numbers, and a support organisation is measured on them. Every closed ticket ends in a score, and those scores roll up into this row rather than into a survey nobody opens.
Reported by customer, by team, by product. The same scores, three ways, so a bad month is attributable to an account, a shift or a component instead of being felt in general.
A row opens in place. Underneath any customer is the ticket behind their number, with the logs and screenshot that attached themselves when it was raised, and the score that closed it. The queue never leaves the screen.
Working with Stockholm
A design system is a theory until a product tries to use it.
The system was owned by a central team in Sweden. We were in Athlone, building one of the products that had to run on it. That is a relationship with two directions, and both of them mattered.
Taking it seriously is most of why a small team shipped something this dense. We did not design a button, a type scale or a status colour. We spent the time on the things only this product had.
And an operations tool is where a design system meets its hardest case. Tables that run past forty rows. A chart whose entire job is to show a contractual breach. Two audiences with different permissions on one screen. Numbers that must stay readable at a glance and exact to three decimals.
So part of the work was a conversation with Stockholm about where the theory held and where a real product bent it. An extension that stays in your own repository is a fork. The same extension sent back is the system getting better. That exchange is the part I would want to do again, and the part that reads as product work rather than screen work.
The call
Move the gate, not the method.
The sessions were fine. The protocol was fine. The findings were real. The only thing wrong was where in the cycle they happened, which meant every one of them arrived as a change request against work already built.
So testing moved inside the sprint and ran on the previous sprint's designs. There was a hard constraint underneath: the people who ran these networks were in the United States and much of the team was offshore. No version of this ends with the right participant in a room in Athlone inside a fortnight.
Five or six people from the campus, run and analysed the same week. A colleague from finance is not a network engineer, and that is a real compromise. What it buys is the whole class of problem that needs no domain knowledge to find, which turns out to be most of them, while the design can still change.
The research nobody expects in a portfolio
One day, sixty tests, and a network made of bananas.
The opportunity
Ericsson Tech Day fills one building in Athlone for a day. It was the largest testable population this product would ever stand in front of, and it cost nothing to reach.
The objection, and why it was wrong
Almost nobody in that room runs a telecom network. That sounds disqualifying until you remember who buys this: a small operator with no floor of specialists. An interface that only works for someone already fluent was the wrong interface anyway.
The build
So we did not demo the product, we seeded a story. The operator became the Banana Network and its customers were monkeys, carried right through the services, the metrics and the tickets. A testing branch and a SQL statement. No product code changed.
The day
Sixty moderated tests over the day, at an event of 1,200, because people queue for something funny in a way they never queue for an enterprise dashboard. The team stood at the stand all day, so problems found in the morning were fixed and back in front of people by the afternoon.
git checkout -b tech-dayUPDATE tenant SET name = ...deploy to the standThanks everyone for sharing your images and letting us take videos during Tech Day we have so much more videos and quirky demos to share stay tuned we will update the blog t.co/uTbEBGAwGO #TechDayAthlone
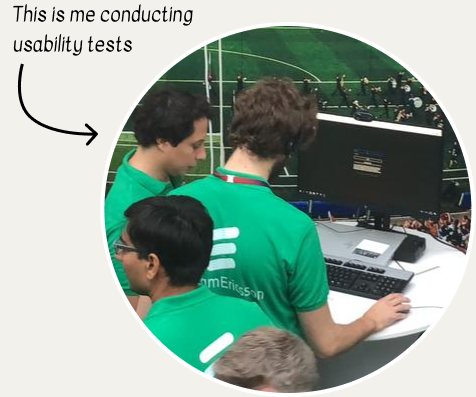
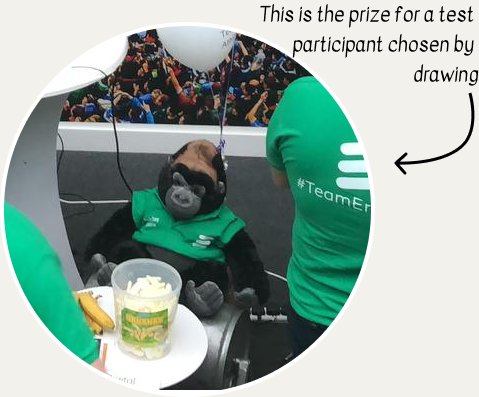
4 October 2018 · Athlone View the post →
What changed
The number that mattered was when, not what.
Same team, same methods, same people. Only the timing moved.
Found while the design was still a design, rather than raised as a defect against work already built. The whole argument for testing inside the cycle, in one number.
Run at Tech Day, an event of 1,200 people, on a branch where the tenant had been reseeded so nobody could pass a task on domain knowledge alone. Findings were fixed the same afternoon.
And the measures the portal was held to after launch, agreed with the product team rather than chosen afterwards to flatter the result:
From inside the team
The people who had to build it.
"His designs, user journeys, UX research reports and usability tests are always done with a focus on end users, dedication and high quality, and they were always clear and well reported at any stage, so that everyone in the team was on the same page."
Lorenzo MartinoBackend engineer, Ericsson
"His designs are excellent, and well presented in the sense that a non UX person was able to grasp the benefits and reasoning for doing things a certain way."
Oshi KavadiaDevOps, Ericsson
"A passionate designer who was quick to offer compelling design solutions, often under pressure and to tight deadlines. Great with detail, open to new ideas, and fun to work with."
Marlon BundayLead Designer, Ericsson